Heuristics is experience-based techniques for problem-solving, learning, and discovery that find a solution which is not guaranteed to be optimal, but good enough for a given set of goals.
Where the exhaustive search is impractical, heuristic methods are used to speed up the process of finding a satisfactory solution via mental shortcuts to ease the cognitive load of making a decision.
For a golf course, there are five benchmarks that determine the profit potential of a golf course.
1. The relationship between demand and supply.
The national benchmark is 1,710 golfers per 18 holes. Within the top 100 core based statistical areas, i.e., large metropolitan areas, there are 2,233 golfers per 18 holes. If a golf course has less than 1,000 golfers per 18 holes within a 10-mile radius, it will be challenged to break-even
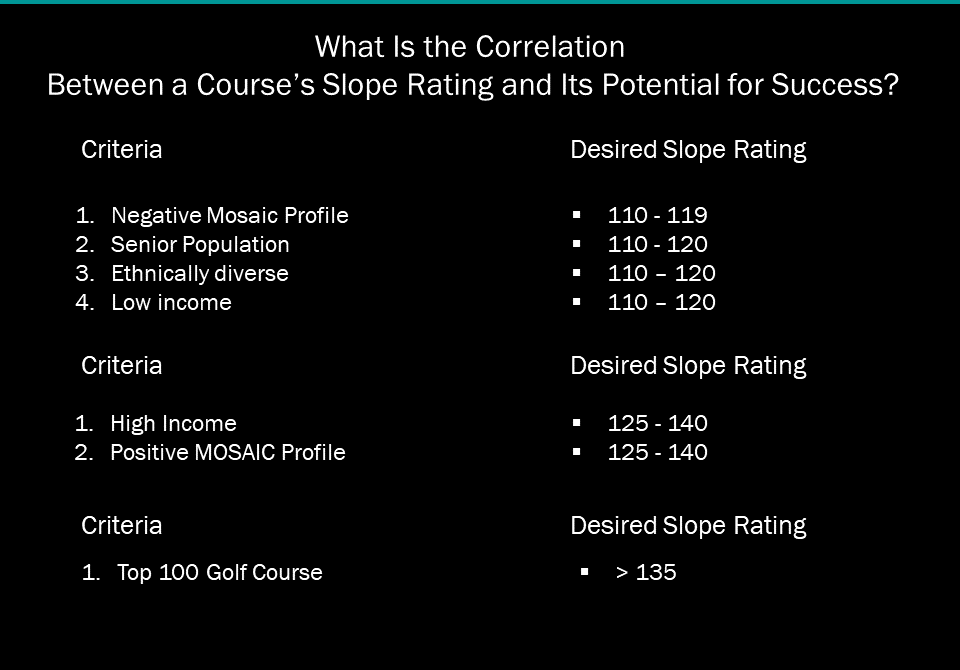
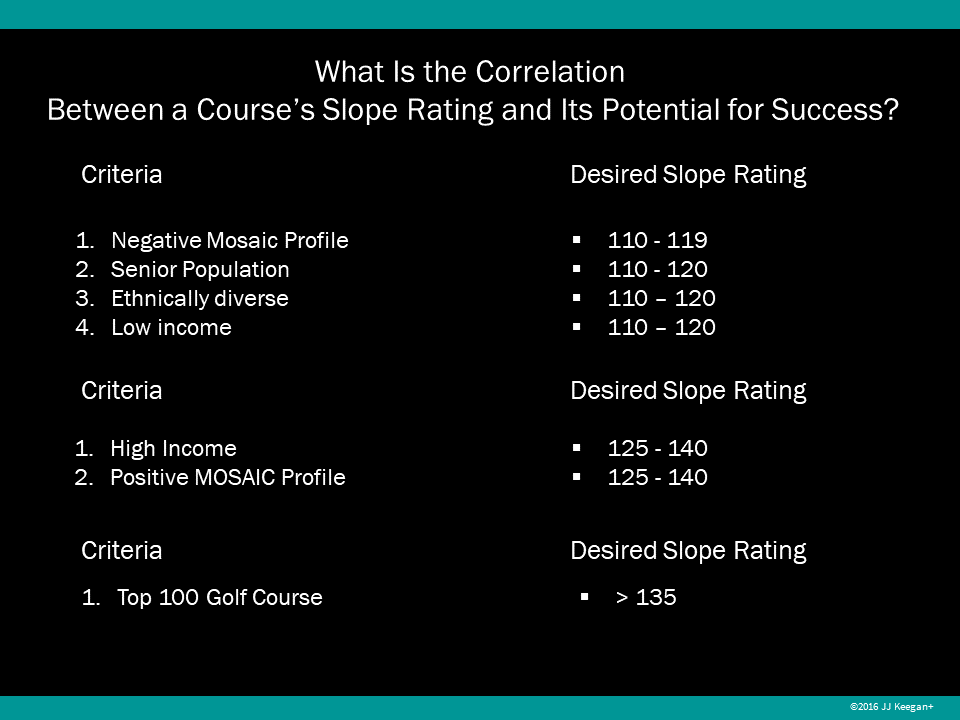
2. The correlation between the MOSAIC Profile and the course’s slope rating.
The MOSAIC profile is an altitudinal behavior segmentation that assigns individuals to one of ten categories, i.e., career and family, bourgeois prosperity, sophisticated singles, comfortable retirement, hard working blue collar, routine service workers, low-income elders, metropolitan strugglers, and rural inheritance.
The correlation between the MOSAIC profile index and the ideal slope rating for a golf course is shown here:
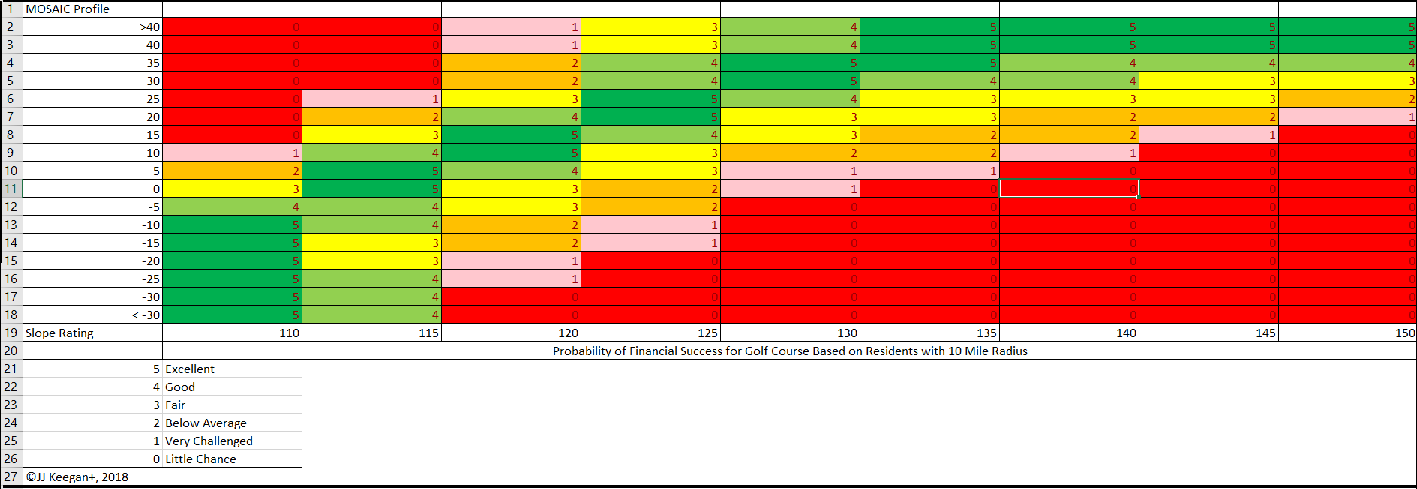
Note that the MOSAIC Profile Index for a golf course is calculated based on the percentage that sophisticated single, bourgeois prosperity, career and family and comfortable retirement within the 10-mile radius of the golf course exceeds the national average. To illustrate, by Pelican Hills Golf Course in Irvine, CA the MOSAIC Profile is greater than 40% as it also is on the north side of Chicago. Conversely, the MOSAIC Profile on the southwest side of San Antonio is a negative 30%.
Presented below is a chart depicting the financial potential for a golf course based on the correlation of the MOSAIC profile and the slope rating.
3. Revenue per round sold. You can reasonably estimate the revenue at any public golf course based on three data points. The formula is multiple the prime time rack rate, times the numbers of rounds (starts) times 60%. If a golf course is netting under 50%, they are discounting excessively reducing the potential for investment success. There are one or to gotchas is this benchmark. If the course does not return to the clubhouse after nine holes, the effective RevPAR should be 65% or higher.
4. Fringe benefits. When fringe benefits exceed 40% of salary plus fringe benefits, wages paid are excessive. The key to the success of management companies is that they average 22% for fringe benefits. Municipalities should consider privatizing management of their courses when the fringe benefit percentage exceeds 40%. A quick test to see if the municipality will benefit is to multiple their fringe benefit cost percentage minus 22% – minus $90,000, the estimate current expense leading management companies charge. To the extent, the number is greater than zero; privatization becomes a viable option.
5. Water Expense. $1.20 per thousand gallons or $391 per acres feet are the watermarks for this vital expenses. When water costs, as they do throughout much of the southwest and west, exceed $3.00 per thousand gallons, generating sufficient cash flow to fund debt service and create capital reserves become a huge problem.
While the five benchmarks listed above represent the “acid test” for the financial potential profitability of a golf course, there are other benchmarks to help a golf course owner ensure that the economics of their golf course is sound.
Bonus Benchmark 1: Maintenance Expenses times .0001 should represent the prime time green fee. How as this determined. The average green fee is that America is $48. The average maintenance budget for a public course is $480,000. The average maintenance budget for a private club is $900,000. The average guest fee? You guessed it – $90.00. This is a perfect example of how to apply heuristics to guide one in the financial management of their facilities. If a facility maintenance expenses are 750,000 and the green fee is only $45, this highlights an imbalance that serves as a warning to the course owner.
Bonus Benchmark 2: The total debt a golf course can reasonably carry is $3.3 million. This presumes a 4% loan amortized over 30 years. The annual payment nearing $200,000 would equal the median earnings before depreciation, interest, and amortization of public golf courses according to the PGA Facility Operations Scorecard.
If you have questions regarding how to apply these benefits or are seeking a financial health check of your facility, please call JJ Keegan at 303.596.4015.

Josh Lesnik
JJ, Great article. Josh