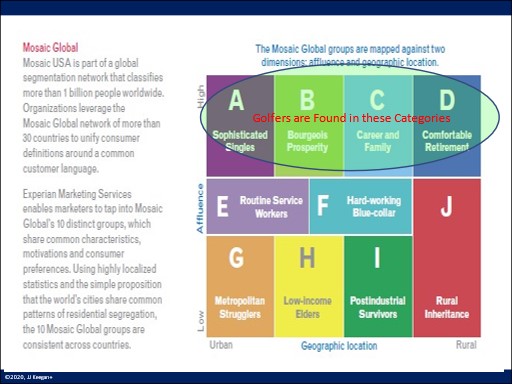
While there are over 16,000 golf courses in the United States, each offering a different experience, three uncontrollable factors determine the future economic return a facility might achieve.
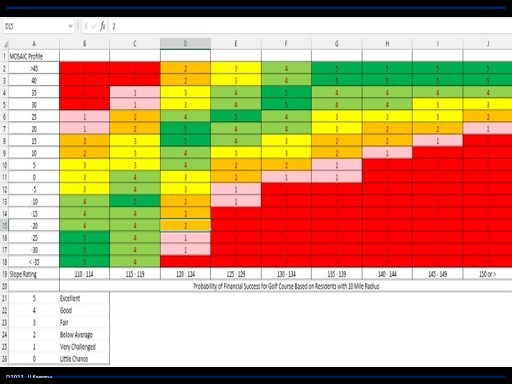
- The Predictive Index: the correlation between the Mosaic Global Profile Index and the Course’s Slope Rating.
- Demand vs. Supply: the Number of Golfers and Consumer Spending per 18 holes within a 10-mile radius (30-minute drive time) of the facility.
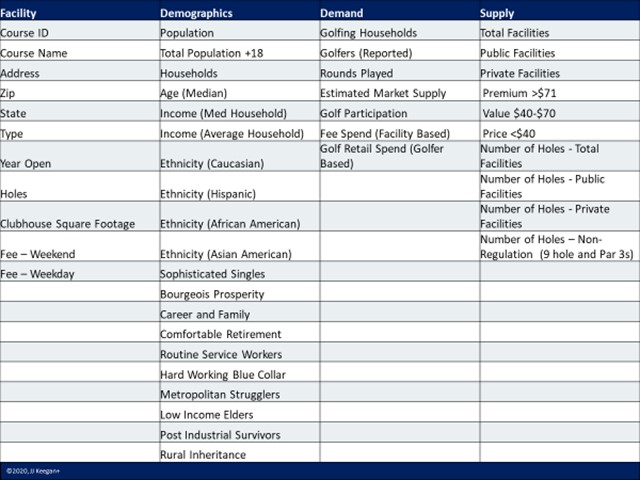
- The JJ Keegan+ Matrix Ranking: 44 variables were analyzed in which 1.7 million calculations were made to determine the probability of success for each golf course in the United States from 1 to 14,613.
Do You Wonder What Your Numbers Are?
If your golf course is located within the United States, you are welcome to call us at 303 596 4015, and we would be glad to share in a 15-minute zoom conference these vital statistics for your facility.
This data forms the foundation for our Seven-Step Executive Review. In posting this blog on Mat 4, 2022, note that we are in Spain, England, and Wales from May 16 to June 8 and will schedule conferences before we depart or upon our return.
Here is why these numbers are important to the profitable management of your facility.
The Predictive Index
It is essential to understand the subtle nuance that not every golf course is ideal for every type of golfer. A new entrant would quickly abandon the game if required to play Bethpage Black, Oakmont, or TPC Sawgrass frequently. Conversely, a skilled player would tire if it was mandated that they play courses with slope ratings than 115.
How do you know if the golf course experience you provide is ideal for your local target market?
The MOSAIC Profile Index provides the answer. Experian segments the U.S. Population into the following categories based on attitudinal behavior:
To determine a course’s MOSAIC Profile index, the percentage of sophisticated singles, bourgeois prosperity, career and family, and comfortably retired individuals living within 10 miles of the golf course is compared to the U.S. population.
To illustrate, if the population of these four categories was 40% greater than that of the U.S. at large, think Newport Beach, CA, or the North Side of Chicago, it is indicative the residents are seeking a more challenging golf course. Conversely, if the MOSAIC profile is a negative 40%, think the southwest side of San Antonio or many inner cities, these golfers are more inclined to play a more straightforward golf course.
Suppose the MOSAIC profile is negative and the slope rating is high. In that case, you can be confident that the golf course is financially challenged and is solely dependent upon the importation of golfers from beyond the 10-mile radius to achieve positive cash flow.
The relationship between the MOSAIC profile and the course’s slope rating forms the Predictive Index shown below and is the first uncontrollable benchmark of a golf course’s financial potential:
DEMAND VS. SUPPLY
Two benchmarks provide a prescient view of the financial potential for a golf course: the number of golfers and the dollars spent by consumers per 18 holes within a 10-mile radius of the golf course.
The number of golfers per 18 holes is often confused. There are 1,534 golfers per course, 1,711 golfers per facility, and 2,283 golfers per facility within the Top 100 Core-based statistical areas (the largest metroplexes) as of 2020. It should be understood that these numbers, like stock prices, are constantly changing based on course opening, closing, and the influx/outflow of golfers participating in the sport.
This confusion is often compounded by some research institutions reporting demand vs. supply based on the number of golfers per the number of holes in the U.S.
While precise numbers are always preferred, a macro view provides strategic insights into the health of the golf industry, as shown below:
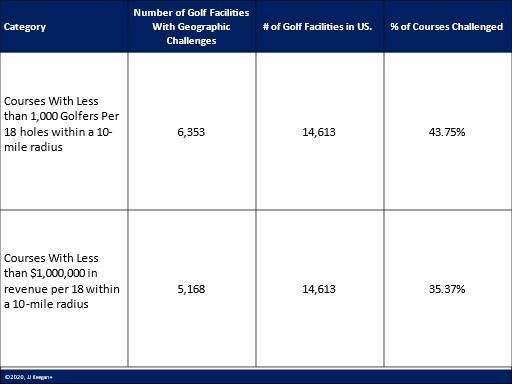
The fact that 43.75% of golf courses have less than 1,000 golfers per 18 holes living within 10 miles of a facility is alarming. It supports the industry projections that between 750 – 1,000 golf courses are likely to close by 2030 – notwithstanding the surge in golf produced by the Pandemic.
The JJ Keegan+ Matrix Ranking:
As Dustin Hoffman would likely have done in the movie “Rainman,” we analyzed 44 variables in which 1.7 million calculations were made to determine the probability of success for each golf course in the United States from 1 to 14,613.
To rank order every golf course in the U.S., we compared the data points of each course within a 10-mile radius in relationship to every course in the U.S. The following benchmarks heavily influenced the ranking:
- MOSAIC Profile
- Age
- Income
- Ethnicity
- Golfers per rounds played
- Household Participation
- Golfers per 18 holes
- Rounds played per 18 holes
- Supply per 18 holes
- Green fee and cart spending per 18 holes
- Merchandise and food and beverage per 18 holes
We totaled the spending allocated to each golf course and compared it to economic studies regarding total economic impact of the golf industry. The variance was less than 2%.
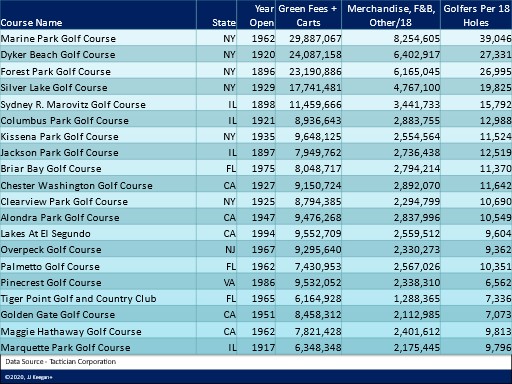
It was no surprise that the golf courses which have the highest potential are located within the major metropolitan areas of the United States, as shown below:
Are these municipal golf courses listed at the top of chart likely realizing the gross income reflected in the chart above? No chance. Why not?
The calculation measured the total spending per 18 holes within a 10-mile radius. Private clubs, of which there are a plethora in the major metropolitan areas across the United States, generate nearly five times that of a municipal golf course.
There is one statistic that reflects the potential of these courses: the number of golfers per 18 holes. Compared to a national average of 1,711 or 2,268 within the Top 100 core-based statistical areas, demand vastly exceeds supply in the markets identified above.
Does it mean each of these golf courses listed is financially thriving? The answer is they should be if course conditions, customer service, and the rates charged are consistent with the experience desired by the customer. If they are struggling, those factors, not demographics, would be the source of their woes.
The other side of the coin reveals a grimmer story. Presented below are the 20 golf courses in the United States, based on their location, that have the most significant challenge to achieving fiscal sustainability.
 Will all those golf courses fail? The critical criterion for their success is attracting sufficient golfers beyond the 10-mile radius of their facility.
As would be expected, golf courses in the outlying areas of the U.S. ranked the lowest in profit potential.
Caveats
These three factors, the Predictive Index, Demand vs. Supply (golfers and spending) and the JJKeegan Ranking Matrix, are reliable indicators for daily fees and municipal golf courses.
Further, the presumption is that 80% of the golfers reside or are employed at businesses within 10 miles of the golf course.
If these benchmarks are adverse, a golf course still may be highly successful if management creates a superior value-based experience that attracts golfers beyond the 10-mile radius, think Bandon Dunes, the Jones Trail, and Sand Valley. These benchmarks would also not be applicable for resorts.
Is the 10-mile radius benchmark for the concentration of golfers and their residential spending an accurate parameter? Not quite. But we believe it is a very reliable indicator for 95% of municipal golf courses, 80% of daily fee golf courses, perhaps 60% of private clubs where the aspirational and status of the club is a draw, and less than 40% of resorts that are dependent upon tourists for their revenue.
Also, bumps in the green fee are possible with a golf course that provides all bent grass, multiple layers of rough, an extensive driving range, and a short-game area. Golf courses benefit even further in their pricing capability when they offer majestic views or have hosted national and state golf championships.
Do You Wonder What Your Numbers Are?
If your golf course is located within the United States, you are welcome to call us at 303 596 4015, and we would be glad to share in a 15-minute zoom conference these vital statistics for your facility.
This data forms the foundation for our Seven-Step Executive Review. In posting this blog on Mat 4, 2022, note that we are in Spain, England, and Wales from May 16 to June 8 and will schedule conferences before we depart or upon our return.
ARTURO AMADOR VILLARELLO
We have 2 lands in Yucatán and El Paso, 1,200 hectares, please call +529994935222