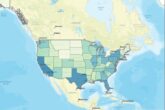
What do Starbucks and the golf course have in common? Far more than you think.
How do Nordstrom, Neiman Marcus, Outback, Starbucks, Four Seasons, Ritz Carlton, and every other department store, restaurant, and hotel chain determine the locations for their businesses? They evaluate demographics.
To determine the location of their retail locations, they use the ESRI Tapestry Segmentation (Available from ArgisOnline) or MOSAIC™ lifestyle Segmentation system (Available from Tactician)
ESRI provides 67 distinct markets of detail representing the diversity of the American population. Grouping the segments can simplify these differences by summarizing markets with similar traits. There are 14 LifeMode groups and six Urbanization groups[1].
LifeMode groups represent markets that share a common experience—born in the same generation or immigrated from another country, for example—or a significant demographic trait, such as affluence. Tapestry segments are classified into 14 LifeMode groups:
Tapestry groups are also available as Urbanization summary groups, in which markets share similar locales, from the urban canyons of the largest cities to the rural lanes of villages or farms. Tapestry segments are classified into six Urbanization groups:[2]
The Suburban Periphery group consists of the following segments: Top Tier, Professional Pride, Boom burbs, Savvy Suburbanites, Exurbanites, Urban Chic, Pleasantville, Enterprising Professionals, Workday Drive, Home Improvement, Comfortable Empty Nesters, Parks and Rec, Midlife Constants, up-and-coming families, Silver and Gold, Golden Years, and the Elders.
If one analyzes this data within a 10-minute drive time radius from the golf course, it becomes an accurate predictor of the financial success of a golf course. Illustrated below are five golf courses. Those with the highest Suburban Periphery have the potential to operate a profitable golf course.
| Category | Pajaro – CA | Pebble Creek, NC | Eagle Point – OR | Roadrunner – TX | Druids Glen, WA | |
| 1 | Principal Urban Center | 0.00% | 0.00% | 0.00% | 0.26% | 0.00% |
| 2 | Urban Periphery | 45.88% | 7.55% | 20.01% | 30.30% | 11.47% |
| 3 | Metro Cities | 0.00% | 0.06% | 0.00% | 27.44% | 0.00% |
| 4 | Suburban Periphery | 0.08% | 63.97% | 0.00% | 26.17% | 74.50% |
| 5 | Semi-Rural | 54.04% | 25.54% | 43.91% | 0.15% | 0.00% |
| 6 | Rural | 0.00% | 2.88% | 36.08% | 15.69% | 1.67% |
A second consumer segmentation analysis is Experian Mosaic Global, a consistent segmentation system covering over 284 million households worldwide. It is based on the simple proposition that the world’s cities share common patterns of residential segregation. Using local data from 16 countries and statistical methods, Experian has identified ten distinct types of residential neighborhoods, each with a distinctive set of values, motivations, and consumer preferences, which can be found in each country.[3]
The ten categories are as follows:
- A Sophisticated Singles
- B Bourgeois Prosperity
- C Career and Family
- D Comfortable Retirement
- E Routine Service Workers
- F Hard Working Blue Collar
- G Metropolitan Strugglers
- H Low-Income Elders
- I Post Industrial Survivors
- J Rural Inheritance.
The objective of this typology is:
- To classify neighborhoods in a way that provides the most powerful description of consumers’ behavior, lifestyles, and attitudes.
- To identify lifestyle groups that are as recognizable and meaningful as possible to marketers.
- To ensure that each named group contains sufficient numbers of households to be statistically reliable for most analyses.
- To ensure that each cluster is homogeneous regarding demographics and consumer behavior.
- To avoid an excessive concentration of individual U.S. MOSAIC types within particular geographic regions, except where appropriate.”[4]
Every golf course is unique, and every market is local. Thus, to determine any golf course’s financial potential, you must understand the market’s demand and supply details, starting with the MOSAIC profile.
Having established that the game of golf is played mainly by Caucasian, well-to-do, above-the-average-age people on golf courses located where there is a heavy concentration of lifestyle groups classified as “Sophisticated Single, Bourgeois Prosperity, Career and Family, and Comfortable Retirement, ” golf courses located in areas classified as routine service workers, hard-working, blue-collar, metropolitan strugglers, low-income elders, or post-industrial survivors are likely to outperform those golf courses located in areas classified as routine service workers, hard-working, blue-collar
To determine a course’s MOSAIC Profile index, the percentage of sophisticated singles, bourgeois prosperity, career and family, and comfortably retired individuals living within 10 miles of the golf course is compared to the U.S. population.
To illustrate, if the population of these four categories was 40% greater than that of the U.S. at large, think Newport Beach, CA, or the North Side of Chicago, it is indicative the residents are seeking a more challenging golf course. Conversely, if the MOSAIC profile is a negative 40%, think the southwest side of San Antonio or many inner cities; these golfers are more inclined to play a more straightforward golf course.
Suppose the MOSAIC profile is adverse and the slope rating is high. In that case, you can be confident that the golf course is financially challenged and is solely dependent upon the importation of golfers from beyond the 10-mile radius to achieve positive cash flow.
Crystal Mountain, a fabulous resort course 30 miles outside of Traverse City, MI, depends on the influx of tourists from Chicago and Detroit. Oak Creek, located at the Intersection of the Five and the 405 in Irvine, California, is magnificently positioned to do well, as is Pine Meadow in Mundelein and Cedar Creek in San Antonio.
But the MOSAIC profile is only the first hurdle that one must overcome.
It is essential to understand the subtle nuance that not every golf course is ideal for every type of golfer. A new entrant would quickly abandon the game if required to frequently play Bethpage Black, Oakmont, or TPC Sawgrass. Conversely, a skilled player would tire if mandated to play courses with slope ratings over 115.
How do you know if your golf course experience suits your local target market?
The relationship between the MOSAIC profile and the course’s slope rating forms the Predictive Index shown below and is the first uncontrollable benchmark of a golf course’s financial potential:
[1] Esri Tapestry Segmentation—Esri Demographics Regional Data | Documentation (arcgis.com)
[2] Esri Tapestry Segmentation—Esri Demographics Regional Data | Documentation (arcgis.com)
[3] Experian, Mosaic Global E-Handbook, Pg 2.


