While nearly 16,000 golf courses are in the United States, each offering a different experience, three uncontrollable factors determine the future economic return a facility might achieve.
Operating a golf course requires three initial questions to be answered.
- What is the – Annual Potential Revenue at Your Golf Course?
Our research shows that the average golf course only realizes 70% of its potential revenue, leaving hundreds of thousands of dollars on the table.
- What is the Ideal Golfer Profile that matches the experience you are offering?
Is your facility likely to appeal to the casual, core, or avid golfer?
- What is the Appropriate Green Fee?
Most golf course managers set prices based on their dumbest competitor’s tariff. However, if the JJ Keegan+ Customer Value Experience Index template is implemented, this doesn’t need to be the case.
The preliminary answers to the first two questions these questions can be determined by undertaking an analysis of the demographics in the local market comprising:
- The JJ Keegan+ Matrix Ranking: 44 variables to determine the revenue potential of each golf course in the United States from 1 to 13,946.
- The Predictive Index: A unique blending of the local demographics with the facility’s slope rating defines the type of golfer you will attract and retain.
- Demand vs. Supply: The Number of Golfers and Consumer Spending per 18 holes within a 10-mile radius (30-minute drive time) of the facility. Understanding your customers’ common characteristics, motivations, and preferences, we intersperse that data amongst six yardsticks to calculate the correct rate centered on the experience your facility offers. The six key ingredients are the slope rating, strategy, course conditions, types of grasses, the ambiance, and the amenities provided.
| JJ Keegan+ Matrix Ranking |
As Dustin Hoffman would likely have done in the movie “Rainman,” we analyzed 44 variables in which 1.7 million calculations were made to determine the probability of success for each golf course.
To rank order every golf course in the U.S., we compared the data points of each course within a 10-mile radius to every course in the U.S. The following benchmarks heavily influenced the ranking:
- MOSAIC Profile
- Age
- Income
- Ethnicity
- Golfers per round played.
- Household Participation
- Golfers per 18 holes
- Rounds played per 18 holes
- Supply per 18 holes
- Green fee and cart spending per 18 holes
- Merchandise and food and beverage per 18 holes
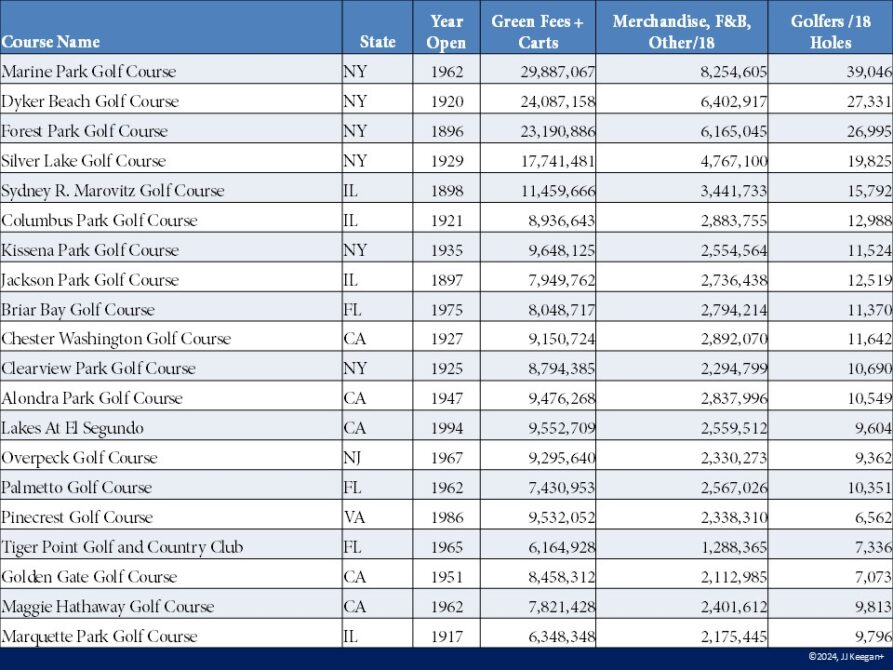
We totaled the spending allocated to each golf course and compared it to economic studies regarding the total economic impact of the golf industry. The variance was less than 2%. It was no surprise that the golf courses which have the highest potential are located within the major metropolitan areas of the United States, as shown below:

Are these municipal golf courses listed at the top of the chart likely to realize the gross income reflected in the chart above? No chance. Why not?
The calculation measured the total spending per 18 holes within a 10-mile radius. Private clubs, of which there are a plethora in the major metropolitan areas across the United States, generate nearly five times that of a municipal golf course.
Does it mean each of these golf courses listed is financially thriving? The answer is they should be if course conditions, customer service, and the rates charged are consistent with the experience desired by the customer. If they are struggling, those factors, not demographics, would be the source of their woes.
While some may be concerned with the analysis date 2016, the number of golfers has increased similarly to the rounds. With the closure of 1,257 18-hole equivalents (257,193 holes in 2016 vs. 234,564 holes in 2023), it can be reasonably estimated that the potential spending per course has increased.
This analysis answers the question of a golf course’s revenue potential. It provides a barometer for existing golf course owners to determine how efficiently they capture revenue within their market. It also provides a golf course buyer or seller with an indicator of the fair market value.
The statistics for each golf course in the country are an integral part of the integral property of JJ Keegan+ and are available to purchasers of 2024 published “The Business of Golf – What Are Other Thinking? via a a 30-minute complimentary Zoom meeting. Our professional goal is to ensure each golf course owner maximizes their revenue. Let’s help you achieve your potential.

