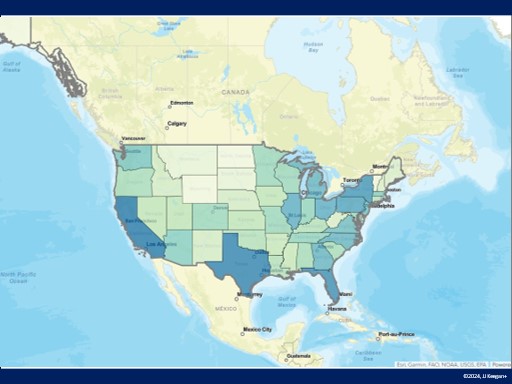
The first criterion for where you would want to locate a golf course would be a location where the number of participants in the State per golf course was high.
The critical relationship is the number of participants in the State measured against the number of golfers, implying where demand may exceed supply. Nationally, in 2023, there were 1,586 golfers per course based on the data available within the ESRI online database.[1]
The number of golfers per 18 holes is often confusing.
There are 1,605 golfers per course (25.6 million golfers/15,945 courses), 1,835 golfers per facility (25.6 million golfers/13,946 facilities), and 1,940 golfers per 18-hole equivalent (25.6 million golfers / (237,564 holes/18). It should be noted that there are approximately 2,300 golfers per facility within the Top 100 Core-based statistical areas (the largest metroplexes) as of 2022.
Note the slight statistical immaterial variance in the number of golfers per 18 holes (1,586) by ESRI vs (1,605) calculated by the NGF.
Presented below are the top 10 states measured based on participants per course.
| Rank | State | 2023 Participated in Golf | # Courses Per State | Participated Per State |
| 1 | District of Columbia | 49,038 | 1 | 49,038 |
| 2 | Hawaii | 99,817 | 28 | 3,565 |
| 3 | Utah | 259,541 | 85 | 3,053 |
| 4 | New Jersey | 698,106 | 250 | 2,792 |
| 5 | California | 2,678,337 | 982 | 2,727 |
| 6 | Maryland | 505,478 | 186 | 2,718 |
| 7 | Texas | 2,134,102 | 805 | 2,651 |
| 8 | Alaska | 57,736 | 23 | 2,510 |
| 9 | Colorado | 495,971 | 208 | 2,384 |
| 10 | Washington | 654,583 | 285 | 2,297 |
The other side of the coin has another side; here are the States where participation by residents in relationship to the number of golf courses is low:
| Rank | State | 2023 Participated in Golf | # Courses Per State | Participated Per State |
| 1 | South Dakota | 75,829 | 154 | 492 |
| 2 | North Dakota | 70,455 | 141 | 500 |
| 3 | Wyoming | 49,179 | 98 | 502 |
| 4 | Montana | 95,027 | 147 | 646 |
| 5 | Iowa | 273,833 | 394 | 695 |
| 6 | Nebraska | 166,568 | 232 | 718 |
| 7 | Maine | 118,259 | 142 | 833 |
| 8 | Vermont | 58,128 | 67 | 868 |
| 9 | Michigan | 805,494 | 873 | 923 |
| 10 | Wisconsin | 497,117 | 524 | 949 |
In the over 300 surveys we have conducted, the average golfer plays about seven different courses per year, averaging 20 rounds per year[2]. Most golf courses will serve interestingly between 4,000 and 11,000 unique individuals annually. If one multiplies the 1,586 golfers per state by the average number of rounds they play a year, that forecasts the number of rounds that will be played at their facility: 31,727.
The rounds per facility at the Top 100 CBSA, at 51,111, far exceed the average of 31,727. Interestingly, an estimated 40.9 million rounds are played on slightly over 2,200 golf courses, averaging 18,529 rounds per facility outside core statistical-based areas in the United States.
While these statistics serve an anecdotal interest, two benchmarks provide a proactive view of the financial potential for a golf course: the number of golfers and the dollars consumers spend per 18 holes within a 10-mile radius of the golf course.
T
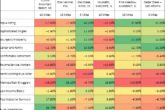
These numbers, like stock prices, are constantly changing based on course opening and closing and the influx/outflow of golfers participating in the sport. While precise numbers are always preferred, a macro view provides strategic insights into the health of the golf industry, as shown below:
| Category | Number of Golf Courses with Geographic Challenges | Percent of Courses that Potentially Faced Economic Challenges |
| Courses With Less than $1,000,000 in revenue per 18 Within 10 miles | 4,694 | 32.12% |
| Courses With Less than 1,000 Golfers Per 18 Within 10 Miles | 5,879 | 41.58% |
The fact that 43.47% of golf courses have less than 1,000 golfers per 18 holes living within 10 miles of a facility is alarming. It supports the industry projections that between 600 and 800 golf courses will likely close by 2030 – notwithstanding the surge in golf produced by the pandemic.
CAVEATS
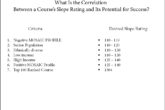
The JJ Keegan+ Rating Matrix, the Predictive Index, and Demand vs. Supply (golfers and spending) are reliable indicators for daily fees and municipal golf courses.
Further, the presumption is that 80% of the golfers reside or are employed at businesses within 10 miles of the golf course.
If these benchmarks are adverse, a golf course may be highly successful if management creates a superior value-based experience that attracts golfers beyond the 10-mile radius; think Bandon Dunes, the Jones Trail, and Sand Valley. These benchmarks would also not apply to resorts.
Is the 10-mile radius benchmark for the concentration of golfers and their residential spending an accurate parameter? Not quite. But we believe it is a very reliable indicator for 95% of municipal golf courses, 80% of daily fee golf courses, perhaps 60% of private clubs where the aspirational and status of the club is a draw and less than 40% of resorts that are dependent upon tourists for their revenue.
Also, bumps in the green fee are possible with a golf course providing all bent grass, multiple rough layers, an extensive driving range, and a short-game area. Golf courses benefit even further in their pricing capability when they offer majestic views or have hosted national and state golf championships.
These golf courses have a competitive edge over their peers because of the many golfers available per facility. They have the advantage of greater price flexibility, and they probably can get away with offering a less attractive
The real key is understanding within your local market the amount residents spend on golfers per 18 holes per person. But even owning a golf course in a leading CBSA is insufficient to ensure financial success at your facility.
What to learn more about the competitive aspects of your market? You are welcome to email jjkeegan@jjkeegan.com to learn that insight. We can provide those insights in less than 60 minutes.
[1] Comparison reports | Reports | ArcGIS Business Analyst
[2] National Golf Foundation, Golf Participation Report (2023), Pg 4.

